
Domestic aviation activity
- Summary
- Time series
- Monthly publications
- Annual publications
- Domestic Aviation Activity—Cities and Regions
Summary
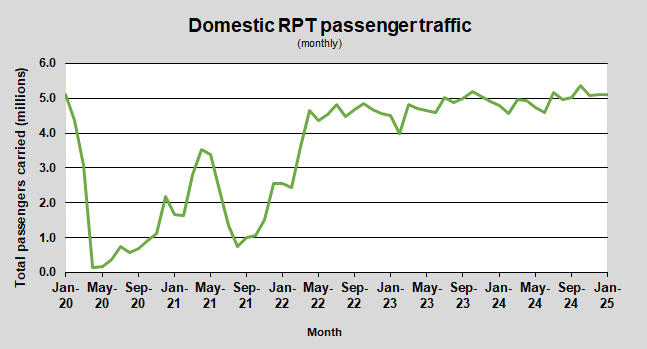
There were 5.46 million passengers carried on Australian domestic commercial aviation (including charter operations) in January 2025, compared with 5.16 million in January 2024 (up 5.8 per cent).
This is also an increase of 2.6 per cent on pre-COVID January 2019 passenger numbers (5.29 million).
5.10 million passengers were carried on Regular Public Transport (RPT) flights in January 2025 (excluding charter operations), an increase of 6.3 per cent compared to January 2024.
For the month of January 2025, there were 49.2 thousand RPT aircraft trips, a decrease of 3.1 per cent on January 2024.
RPT revenue passenger kilometres (RPKs) performed were 6.26 billion for the month, compared with 5.82 billion in January 2024 (up 7.6 per cent).
Capacity, measured by available seat kilometres (ASKs), decreased to 7.44 billion in January 2025 compared to 7.54 billion in January 2024 (down 1.4 per cent).
The industry wide load factor (RPKs/ASKs) increased from 77.1 per cent in January 2024 to 84.1 per cent in January 2025.
Total cargo movements at Australian airports on domestic RPT flights were 24.4 thousand tonnes in January 2025, a decrease of 2.4 per cent compared with January 2024.
In January 2025, there were 2.10 million domestic passenger movements through regional airports, an increase of 6.9 per cent from January 2024.
Fixed-wing charter operators carried 360.2 thousand passengers in January 2025, a decrease of 1.1 per cent compared with January 2024.
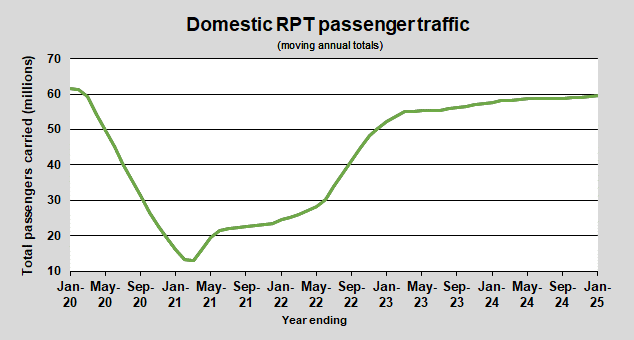
Summary of annual RPT activity
| YE Jan 2024 | YE Jan 2025 | % Change | |
|---|---|---|---|
| Total passengers carried (millions) | 57.57 | 59.59 | 3.5 |
| Revenue passenger kilometres (billions) | 68.76 | 71.45 | 3.9 |
| Available seats (millions) | 73.57 | 74.37 | 1.1 |
| Available seat kilometres (billions) | 85.52 | 86.97 | 1.7 |
| Load factor % | 80.4 | 82.2 | 1.8* |
| Aircraft trips (000s) | 614.1 | 614.8 | 0.1 |
* percentage point difference