International airline activity
- Summary
- Time series
- Monthly publications
- International airlines operated flights and seats
- Annual publications
Summary
Sixty-three international airlines operated scheduled services to/from Australia during the month (includes three dedicated freight airlines but excludes airlines operating only via code share arrangements).
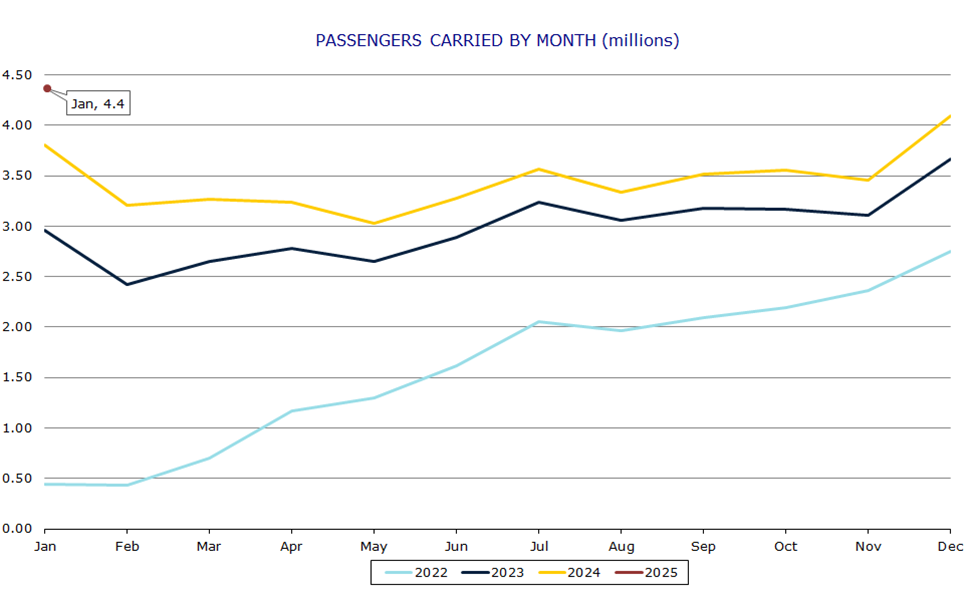
International scheduled passenger traffic in January 2025 was 4.373 million. Passenger traffic was 3.809 million in January 2024 and 2.961 million in January 2023.
Passenger traffic for the year ended January 2025 was 41.922 million. It was 36.626 million for the year ended January 2024 and was 21.597 million for the year ended January 2023.
Total seats made available on international scheduled operations to/from Australia during January 2025 were 5.218 million – an increase of 9.3 per cent compared to January 2024. The overall seat utilisation percentage was 85.5 per cent in January 2025. It was 86.5 per cent in January 2023 and 81.5 per cent in January 2024.
Summary of year on year activity
| Year ended January 2024 | Year ended January 2025 | Change | |
|---|---|---|---|
| Total passenger movements (million) | 36.626 | 41.922 | 14.5% |
Summary of month on month activity
| January 2024 | January 2025 | Change | |
|---|---|---|---|
| Passengers carried (million) | 3.809 | 4.373 | 14.8% |
| Freight (tonnes) | 89 728 | 93 588 | 4.3% |
| Mail (tonnes) | 2 068 | 2 021 | -2.3% |
| Available Seats (million) | 4.776 | 5.218 | 9.3% |
| Flights | 18 650 | 20 022 | 7.4% |
| Aircraft Movements | 19 112 | 20 520 | 7.4% |